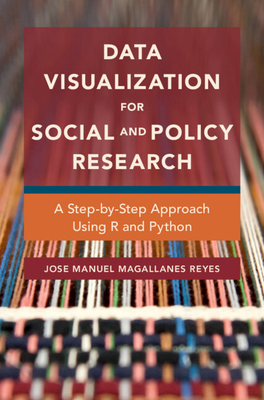
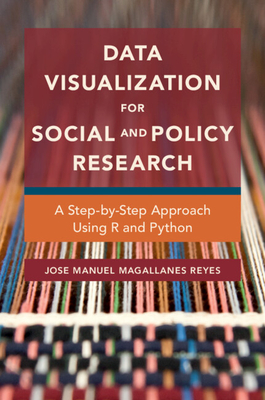
Data Visualization for Social and Policy Research : A Step-by-Step Approach Using R and Python
Book Details
Format
Paperback / softback
ISBN-10
1108714382
ISBN-13
9781108714389
Publisher
Cambridge University Press
Imprint
Cambridge University Press
Country of Manufacture
GB
Country of Publication
GB
Publication Date
Apr 7th, 2022
Print length
292 Pages
Weight
440 grams
Dimensions
15.20 x 23.00 x 2.10 cms
Product Classification:
Research methods / methodologyResearch methods: generalSocial research & statisticsSocial research and statisticsPolitics & governmentPolitics and governmentDigital and information technologies: social and ethical aspectsEthical & social aspects of ITData capture & analysisData capture and analysis
KSh 6,300.00
Currently unavailable
0 in stock
Delivery Location
Delivery fee: Select location
Secure
Quality
Fast
This book teaches basic techniques for produce visualizations of tables, time series, maps, text, and networks that communicate data and analyses creatively and effectively. The step by step presentation helps readers learn coding in R and Python while simultaneously becoming familiar with the advantages and disadvantages of each visual.
All social and policy researchers need to synthesize data into a visual representation. Producing good visualizations combines creativity and technique. This book teaches the techniques and basics to produce a variety of visualizations, allowing readers to communicate data and analyses in a creative and effective way. Visuals for tables, time series, maps, text, and networks are carefully explained and organized, showing how to choose the right plot for the type of data being analysed and displayed. Examples are drawn from public policy, public safety, education, political tweets, and public health. The presentation proceeds step by step, starting from the basics, in the programming languages R and Python so that readers learn the coding skills while simultaneously becoming familiar with the advantages and disadvantages of each visualization. No prior knowledge of either Python or R is required. Code for all the visualizations are available from the book''s website.
Get Data Visualization for Social and Policy Research by Jose Manuel Magallanes Reyes at the best price and quality guaranteed only at Werezi Africa's largest book ecommerce store. The book was published by Cambridge University Press and it has 292 pages.
Customers Who Bought This Also Bought

Finding Your Ethical Research Self
KSh 6,650.00

Island Time
KSh 18,900.00

Fundamental Issues, Measurement and Study Design
KSh 35,100.00

Building a Digital Chemistry Lab
KSh 8,100.00

Data Analysis
KSh 35,100.00

Research Design in Political Science
KSh 6,300.00

Crime Scripting
KSh 7,900.00

Renegade
KSh 30,950.00

Research Design in Political Science
KSh 21,600.00

The Community-Based PhD
KSh 5,050.00
Practical Research Methods for Media and Cultural Studies
KSh 6,900.00

Crime Scripting
KSh 30,950.00