
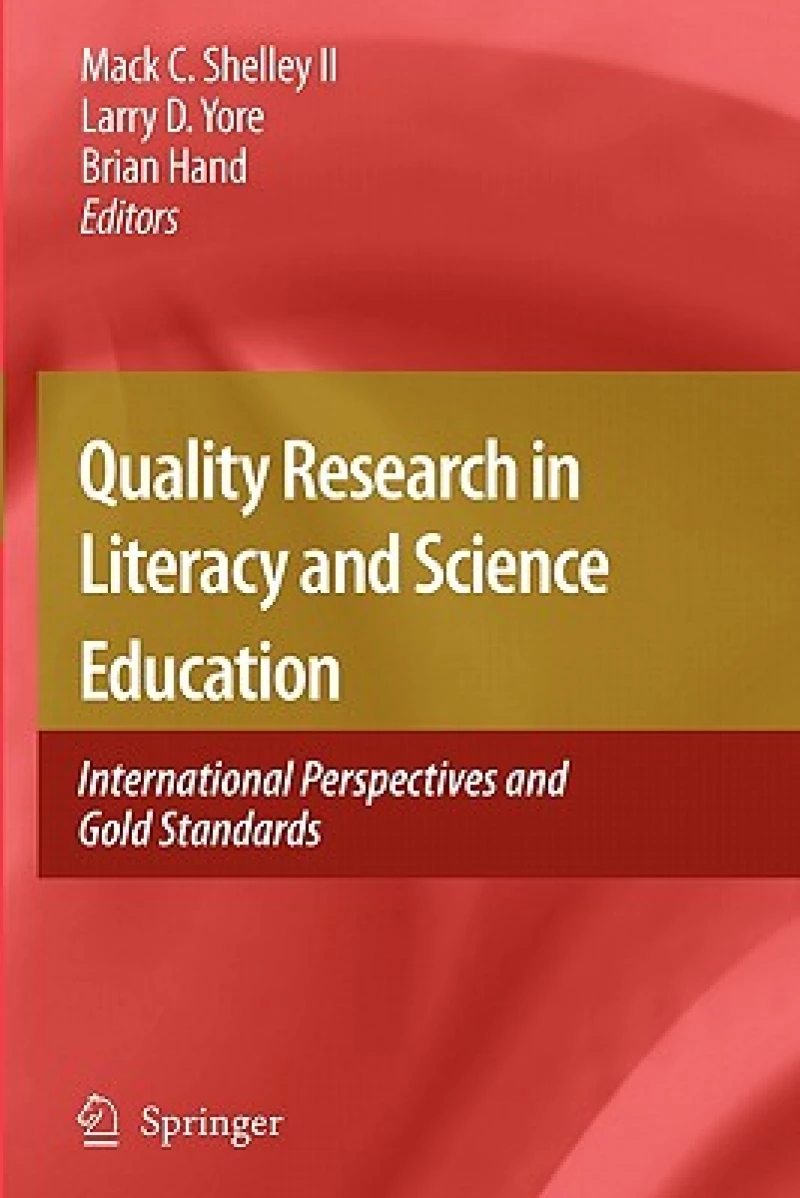
Quality Research in Literacy and Science Education : International Perspectives and Gold Standards
1st ed. Softcover of orig. ed. 2009
Book Details
Format
Paperback / Softback
ISBN-10
9048178770
ISBN-13
9789048178773
Edition
1st ed. Softcover of orig. ed. 2009
Publisher
Springer
Imprint
Springer
Country of Manufacture
NL
Country of Publication
GB
Publication Date
Oct 19th, 2010
Print length
666 Pages
Weight
1,024 grams
Dimensions
23.40 x 15.60 x 4.00 cms
Product Classification:
Language teaching & learning (other than ELT)Language teaching and learningSociologySocial research & statisticsSocial research and statisticsEducationEducation / Educational sciences / PedagogyEducational strategies & policyEducational strategies and policyEducational administration and organizationOrganization & management of educationTeaching of a specific subjectScience: general issues
Ksh 23,400.00
Werezi Extended Catalogue
Delivery in 14 days
1 copies in stock
Delivery Location
Delivery fee: Select location
Delivery in 14 days
Secure
Quality
Fast
In the models presented in this chapter, there is a response variable (sometimes called dependent variable) and at least one predictor variable (sometimes called independent or explanatory variable).
Statistical models attempt to describe and quantify relationships between variables. In the models presented in this chapter, there is a response variable (sometimes called dependent variable) and at least one predictor variable (sometimes called independent or explanatory variable). When investigating a possible cause-and-effect type of relationship, the response variable is the putative effect and the predictors are the hypothesized causes. Typically, there is a main predictor variable of interest; other predictors in the model are called covariates. Unknown covariates or other independent variables not controlled in an experiment or analysis can affect the dependent or outcome variable and mislead the conclusions made from the inquiry (Bock, Velleman, & De Veaux, 2009). A p value (p) measures the statistical significance of the observed relationship; given the model, p is the probability that a relationship is seen by mere chance. The smaller the p value, the more confident we can be that the pattern seen in the data 2 is not random. In the type of models examined here, the R measures the prop- tion of the variation in the response variable that is explained by the predictors 2 specified in the model; if R is close to 1, then almost all the variation in the response variable has been explained. This measure is also known as the multiple correlation coefficient. Statistical studies can be grouped into two types: experimental and observational.
Get Quality Research in Literacy and Science Education by at the best price and quality guaranteed only at Werezi Africa's largest book ecommerce store. The book was published by Springer and it has pages.